


SECTOR ROTATION
Sector rotation is an investment strategy involving the movement of money from one industry sector to another in an attempt to beat the market. It sprouted as a theory from National Bureau of Economic Research (NBER) data on economic cycles dating back to 1854.
Sector rotation is a theory of stock market trading patterns.[1] In this context, a sector is understood to mean a group of stocks representing companies in similar lines of business. The basic premise is, that these stocks can be expected to perform similarly. Additionally, different groups of stocks which have been clustered according to the aforementioned principle will show a different performance.
Sector rotation theory says a number of things. First, whatever sector is hot (has done well recently) should continue to outperform. Second, these sectors will eventually rotate so that whatever was once out of favor will be in favor. Third, these movements are somewhat predictable, and connected with the business cycle.
A sector rotation investment strategy is not a passive investment strategy like indexing, and requires periodic review and adjustment of sector holdings.
Tactical asset allocation and sector rotation strategies require patience and discipline, but have the potential to outperform passive indexing investment strategies.as favoring basic material stocks over semiconductor stocks by calling the environment a sector rotation from semiconductors to basic
An example of a sector clustering would be:
Leading
This includes stocks like consumer cyclicals and financial companies. These would do well when the market is at bottom.
In-line
This includes stocks like technology and telecommunication. These should go up more than the overall market in the main part of a bull market
Lagging
This includes stocks like energy companies. These would do well when the market is at top.
Contrarian
This includes consumer staples. These should do least bad in a bear market.
Note that the performances mentioned are always relative to the overall market. During a bear market it is expected that all stocks will go down some.
Connection with other markets
The primary driver of sector rotation is the variability of currency values (inflationary, disinflationary, or deflationary) and interest rates. As the economy expands, demand for raw materials creates inflationary pressures, which in turn prompt higher interest rates, which increase the value of the currency, which reduces the competitiveness of a country's exports as the currency causes them to cost more to other countries.
This final stage causes the economy to contract, reducing demand for raw materials, which creates deflationary pressures, which in turn prompt lower interest rates, which decrease the value of the currency, which increases the competitiveness of a country's exports—creating a new market cycle.
The relative strength of commodities, bonds, currencies, and stocks shift in this changing monetary climate in a somewhat predictable manner.[3]
An introduction to sector rotation strategies
Every business cycle is different in its own way, but certain patterns have tended to repeat themselves over time.
The business cycle, which reflects the fluctuations of activity in an economy, can be a critical determinant of equity sector performance over the intermediate term. A typical business cycle features a period of economic growth, followed by a period of slowing
growth, and then a contraction, or recession.
Market Cycle in Four Stages
Markets move up and down just like the economy. For the purpose of this discussion, we will divide this cycle into four stages:
- Market bottom: This is represented by diving prices, culminating in a long-term low.
- Bull market: This begins as the market rallies from the market bottom.
- Market top: Just as it sounds, this stage hits the top as the bull market starts to flatten out.
- Bear market: Here we go down again. This is the precursor to the next market bottom.
Most of the time, financial markets attempt to predict the state of the economy – anywhere from three to six months into the future. That means the market cycle is usually well ahead of the economic cycle. This is crucial to remember because as the economy is in the pits of a recession, the market begins to look ahead to a recovery.
Here is a list (in the same order as above) of four basic stages of the economic cycle, and some associated telltale signs. Again, keep in mind that these usually trail the market cycle by a few months.
- Full Recession
This is not a good time for businesses or the unemployed. GDP has been retracting, quarter-over-quarter; interest rates are falling; consumer expectations have bottomed; and the yield curve is normal. Sectors that have historically profited most in this stage include: - Cyclicals and transports (near the beginning)
- Technology
- Industrials (near the end)
- Early Recovery
This is when things start to pick up. Consumer expectations are rising; industrial production is growing; interest rates have bottomed; and the yield curve is beginning to get steeper. Historically, successful sectors at this stage include: - Industrials (near the beginning)
- Basic materials
- Energy (near the end)
- Late Recovery
In this stage, interest rates can be rising rapidly, with a flattening yield curve; consumer expectations are beginning to decline; and industrial production is flat. Historically profitable sectors in this stage include: - Energy (near the beginning)
- Staples
- Services (near the end)
- Early Recession
This is where things start to go bad for the overall economy. Consumer expectations are at their worst; industrial production is falling; interest rates are at their highest; and the yield curve is flat or even inverted. Historically, the following sectors have found favor during these rough times: - Services (near the beginning)
- Utilities
- Cyclicals and transports (near the end)
The cycle then repeats itself.
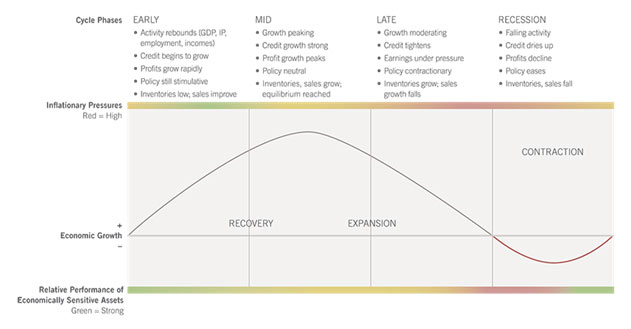
Every business cycle is different in its own way, but certain patterns have tended to repeat themselves over time. Fluctuations in the business cycle are essentially distinct changes in the rate of growth in economic activity. This includes 3 key cycles—the corporate profit cycle, the credit cycle, and the inventory cycle—as well as changes in the employment situation and monetary policy. While unforeseen macroeconomic events or shocks can sometimes disrupt a trend, changes in these key indicators have historically provided a relatively reliable guide to recognizing the different phases of an economic cycle.
4 distinct phases of a typical business cycle:
- Early-cycle phase: Generally, a sharp recovery from recession, marked by an inflection from negative to positive growth in economic activity (e.g., gross domestic product, industrial production), then an accelerating growth rate. Credit conditions stop tightening amid easy monetary policy, creating a healthy environment for rapid profit margin expansion and profit growth. Business inventories are low, while sales growth improves significantly.
- Mid-cycle phase: Typically the longest phase of the business cycle, the mid-cycle is characterized by a positive but more moderate rate of growth than that experienced during the early-cycle phase. Economic activity gathers momentum, credit growth becomes strong, and profitability is healthy against an accommodative—though increasingly neutral—monetary policy backdrop. Inventories and sales grow, reaching equilibrium relative to each other.
- Late-cycle phase: This phase is emblematic of an "overheated" economy poised to slip into recession and hindered by above-trend rates of inflation. Economic growth rates slow to "stall speed" against a backdrop of restrictive monetary policy, tightening credit availability, and deteriorating corporate profit margins. Inventories tend to build unexpectedly as sales growth declines.
- Recession phase: Features a contraction in economic activity. Corporate profits decline and credit is scarce for all economic factors. Monetary policy becomes more accommodative and inventories gradually fall despite low sales levels, setting up for the next recovery.
The performance of economically sensitive assets such as stocks tends to be the strongest during the early phase of the business cycle when growth is rising at an accelerating rate, then moderates through the other phases until returns generally decline during a recession. In contrast, more defensive assets such as Treasury bonds typically experience the opposite pattern, enjoying their highest returns relative to stocks during a recession and their worst performance during the early-cycle phase.
The US economy experienced 11 business cycles between 1945 and 2009, with the average length of a cycle lasting a little less than 6 years.1 The average expansion during this period has lasted 58.4 months, while the average contraction has lasted only 11.1 months.
Some investors seek to profit from changes in the business cycle by using what is called a "sector rotation strategy." A sector rotation strategy entails "rotating" in and out of sectors as time progresses and the economy moves through the different phases of the business cycle.
The strategy calls for increasing allocations to sectors that are expected to prosper during each phase of the business cycle while under allocating to sectors or industries that are expected to underperform. The goal of this strategy is to construct a portfolio that will produce investment returns superior to that of the overall market.
The Bottom Line
With this general outline in mind, traders can try to anticipate which companies will be successful in the coming stages of an economic cycle. Equally important can be the signs the market is exhibiting regarding future economic conditions. Watching for these telltale signs can give great insight into which stage traders believe the economy is currently in.
Currently, the Global Industry Classification Standard (GICS®) structure includes 11 sectors:
- consumer discretionary,
- consumer staples,
- energy,
- financials,
- health care,
- industrials,
- information technology,
- materials,
- real estate,
- telecommunications
- services,
- and utilities
If you've spent any time at all following financial markets, you've probably heard of sector rotation. Certain sectors of business profit more in certain stages of an economic cycle. This simple arrangement of stages provides a useful road map to traders of most stripes.
Sector Rotation is an investment strategy involving the movement of money from one industry sector to another in an attempt to beat the market. It sprouted as a theory from National Bureau of Economic Research (NBER) data on economic cycles dating back to 1854. It's thanks to this cadre of government and academic economists that we know the start, end and duration of each business cycle.
You may have heard of the NBER before: They're the ones that announce that a recession has officially ended – three years after the fact. The data may be slow to develop, and a bit dry, but a little digging can provide insight that investors can use to make decisions.
One underlying premise of sector rotation strategies is that the investment returns of stocks from companies within the same industry tend to move in similar patterns. That's because the prices of stocks within the same industry are often affected by similar fundamental and economic factors. This is a product of the sector classification framework itself: Companies are grouped together based on their business models and operations, which ensures companies within a sector have similar economic exposure and sensitivities.
For example, in the early 2000s, rapid development of new technologies fueled growth within the information technology industry, and most stocks in that sector trended higher. Alternatively, most stocks in the financials sector moved sharply lower during the collapse of the subprime mortgage market and the subsequent credit crisis in 2008–2009. The decline of stocks in the financials sector during the financial crisis once again demonstrated how stocks in the same sector often exhibit similar performance during a particular phase of the business cycle.
Source: Fidelity Investments (AART), as of Sep. 30, 2016.
To implement a sector rotation strategy, many investors deploy a "top down" approach. This involves an analysis of the overall market—including monetary policy, interest rates, commodity and input prices, and other economic factors. This can help investors assess the current economic environment and determine the current phase of the business cycle.
Key economic factors for each sector or industry can also help you create an estimate of future performance for each sector. The next step is to identify sectors or industries that may be well positioned for the current and future phases of the business cycle. Depending on the phase of the business cycle—early, mid, late, or recession—certain sectors may be expected to outperform others. While each business cycle is unique, in the past certain sectors have tended to perform well at different phases of the business cycle (see chart below).
The Best Performing Sectors in Each Phase of the Business Cycle
*Unshaded (white) portions above suggest no clear pattern of over- or underperformance vs. broader US equity market. Double +/- signs indicate that the sector is showing a consistent signal across all 3 metrics: full-phase average performance, median monthly difference, and cycle hit rate. A single +/- indicates a mixed or less consistent signal. Source: Fidelity Investments (AART).

Portfolio construction considerations
A sector-based strategy can be used to construct a portfolio in a variety of ways, and there are a number of vehicles that can help accomplish this objective. In the past, in order to gain exposure to an entire sector or industry, you would have had to buy the stocks of many companies. The amount of capital required to accomplish this would be quite significant, and the commission expenses would also be high.
Today, you can invest in sector-based mutual funds or exchange-traded funds (ETFs) to gain exposure to entire segments of the market. These vehicles enable you to gain the desired sector allocations without having to invest large amounts of capital. They also allow you to more easily execute a sector rotation strategy and tactically adjust your equity portfolios in order to increase exposures to sectors you feel have the best return potential.
Risk factors to consider
Sector rotation strategies may help you align your portfolio with your market outlook and the different phases of the business cycle. With an understanding of how certain sectors have typically performed during each phase of the business cycle, you may be able to position your portfolio optimally.
However, by adopting a sector rotation strategy, you run the risk that your portfolio may experience increased volatility and may underperform the broader market indexes.
Industries within each sector can have significantly different fundamental performance drivers that may be masked by sector-level results, leading to significantly different industry-level price performance. In addition, while diversification may reduce overall risk, remember that it does not ensure a profit or guarantee against a loss.
In Contrast, more defensive assets such as Treasury bonds typically experience the opposite pattern, enjoying their highest returns relative to stocks during a recession and their worst performance during the early-cycle phase.
The US economy experienced 11 business cycles between 1945 and 2009, with the average length of a cycle lasting a little less than 6 years.1 The average expansion during this period has lasted 58.4 months, while the average contraction has lasted only 11.1 months.
Sector rotation strategies may help you align your portfolio with your market outlook and the different phases of the business cycle. With an understanding of how certain sectors have typically performed during each phase of the business cycle, you may be able to position your portfolio optimally.
However, by adopting a sector rotation strategy, you run the risk that your portfolio may experience increased volatility and may underperform the broader market indexes. Industries within each sector can have significantly different fundamental performance drivers that may be masked by sector-level results, leading to significantly different industry-level price performance.
In addition, while diversification may reduce overall risk, remember that it does not ensure a profit or guarantee against a loss.
Some Sector Rotation investors start with a macro-economic analysis of the economy to determine the industries which will experience the greatest growth in the environment they envisage.
They will then center their investment portfolio on those industries, selecting individual companies from within each industry in which to invest.
Other sector investors attempt to anticipate which sectors of a market will perform best over a relatively short period of time, and invest in those sectors before they are "discovered" by the rest of the market. Sector investors may invest in value, growth, small-cap, mid-cap or large-cap stocks.
Want To Spot Sector Rotation In The Market? Employ Multichannel Thinking
A common question that receives from readers is a smart one.
The question: How can someone improve his or her market vision at spotting sector rotation?
Investor’s Business Daily (IBD) is one of the most qualified organizations in the world to answer this.
How so?
The newspaper's founder, William O'Neil, pioneered the study of changes in price momentum among various industries.
With the help of an IBM mainframe computer in the 1960s, O'Neil began presenting institutional clients a market picture that framed not only leading stocks but top-notch industry groups over specific time frames, such as the past six months. Thanks to those efforts, every IBD reader today can track the market like a pro.
If you become savvy at spotting the emerging winners in terms of industries, you've got a leg up. The rationale: If the airline stocks as a group are outstripping the ethical drug firms, then an investor is going to likely make more money with timely purchases of the best stocks in the airline industry.
O'Neil's research determined that up to half a fantastic stock's move is connected to the strength of both its specific industry group and its broad sector.
Look at top industry groups. Here are some tips:
- Keep an eye out for those that jump into the top 20, or even the top 40 among the 197. An easy way to do this: Check the bottom of the General Market page, which is a PDF link at the bottom of the daily Big Picture column.
- What is that breakout stock's industry group? Find out fast at IBD Stock Checkup.
- When a market uptrend warms up, more breakouts tend to come from the same sectors or industry groups.
Lumentum (LITE), Oclaro (OCLR) and Finisar (FNSR) hail from the fiber-optics industry group. Telecoms have thrived in 2016, and the Telecom-Fiber Optics group has ranked No. 1 among 197 IBD groups for weeks.
As you check the industry group rankings, also scan the ranking of 33 broad sectors listed in IBD's stock research tables, which begin on page B6 in the latest IBD Weekly print edition. These rankings can change dramatically over time. Sector Leaders and other young companies with outstanding EPS and RS ratings receive special attention at the top of each sector.
New High List: The stocks are categorized by sector. Lately, bank, financial, medical and select tech plays have led. At Investors.com, the list is updated each day under "IBD Data Tables" in the Stock Lists section.
Scan Stock Market Today: This Investors.com-only feature highlights breakouts. Lately, Wall Street banks such as
Bank of America (BAC), Goldman Sachs (GS), and JPMorgan Chase (JPM), have joined the breakout train.
What's on Leaderboard? Sector Leaders? The former is curated, the latter is computer screen-driven. Both lists tend to show high-growth companies that are coming from the strongest industries.
See Stocks On The Move: This incredibly useful table, found on both the home page and under the "Stock Lists" tab of Investors.com, shows only those stocks making big price moves.
Write down the tickers, especially the ones you don't know, then check out their industry group in IBD Stock Checkup. Maybe certain sectors are sticking out. Don't forget the stocks going down too; it can help you spot emerging weakness in a leading sector.
Follow top-performing ETFs: IBD's ETF Leaders column, which appears in the ETFs section of IBD Weekly, has noted strength in certain commodities such as coal, mining as well as tech-oriented sectors such as semiconductors.
Take a step back: Consider what trends at work and in life are emerging. Cisco Systems (CSCO) wouldn't have been a top growth stock in the 1990s if the internet didn't take root. In the mid-2000s, Apple (AAPL) would have stayed an also-ran if it didn't keep innovating in the field of computers, digital music and phones.
Sector Rotation Based Algorithmic Trading Strategies for Stocks and ETFs
Using an analysis of Sector Rotation based Algorithmic Trading Strategies which rely upon quantitative equity sector predictions computed by aggregating AI forecasting algorithm’s daily signals for S&P 500 stocks show that these aggregated predictions result in high performing trading strategies with:
- Sharpe ratios reaching 1.48
- Returns of up to 70.5% in a 2-year time period
- The possibility of trading up to 195 million US dollars
Algorithmic Sector Rotation Investment Strategies
Tactical Asset Allocation (TAA) attempts to improve a portfolio’s returns by catching near-term outperformance of specific asset classes. A specific form of TAA which seeks to determine which equity sectors will outperform the market in the short term and overweight those sectors in order to generate smart-beta is Sector Rotation.
Of course, this type of strategy relies on a model able to successfully identify market conditions which result in the outperformance of specific sectors. I Know First’s self-learning algorithm is a perfect candidate for this type of prediction as it uses 15 years of historical data to identify recurring patterns in the stock market and generate daily market predictions for a set of over 7,000 assets.
These strategies require relatively less frequent rebalancing with average holding periods between 9 and 10 days and a rough estimate of how much capital can be invested considering liquidity limits gives over 95 million US dollars.
As can be seen above, both ETF strategies exhibit steady and stable growth over the benchmark, avoiding the market downturn in late 2015-early 2016 and presenting steady growth since February 2016. The consistency of the performance lines is thus well expressed in the high Sharpe ratios.
These strategies result in highly profitable portfolios, the best line (row 7) yielding a return of 70.5% in the analyzed time-period versus a return of 18.1% for the benchmark, with all Sharpe ratios clearly above the benchmark.
Creating effective Sector Rotation trading strategies based on sector-level forecasts computed by aggregating the respective stock-level predictions of an AI system can add substantial total portfolio returns over time.
Using ETF’sin Trading Strategies
We show that trading Sector ETFs using these predictions results in portfolios that have strong returns (over 25% in the last 2 years versus the benchmark’s return of 18.1%), low risk (Sharpe ratios above 1.3 and drawdowns below 10%), relatively low rebalancing frequency (9 days), steady growth over the market, and the possibility of trading up to 100 million US dollars.
Stock Trading Strategies
The same concept applied to stocks results in high performing strategies (total returns up to 70%) with risk adjusted returns well above the SPY (Sharpe ratios above 0.8), and the possibility of trading up to 195 million US dollars.
Sector Rotation based trading strategies are popular because they can improve risk-adjusted returns and automate the investing process. Momentum investing, which is at the heart of the sector rotation strategy, seeks to invest in sectors showing the strongest performance over a specific timeframe. Momentum investing is another form of relative strength investing. This article will explain the strategy and show investors how to implement this strategy using the tools at StockCharts.com.
Faber and O'Shaunessey
There are many papers supporting the concept of momentum investing and relative strength investing.
In his book, What Works on Wall Street, James O'Shaunessey details the best performing strategies over the last fifty years.
Now in its fourth edition, O'Shaunessey found that relative strength strategies were consistently at the top of the performance list. Investors are rewarded for buying the strongest stocks and avoiding the weakest. The strong tend to get stronger, while the weak tend to get weaker. This makes sense because Wall Street loves its winners and hates its losers.

Mebane Faber, of Cambria Investment Management, wrote a white paper entitled, Relative Strength Strategies for Investing.
Google his name and the paper name for details. Using sector/industry group data going back to the 1920s, Faber found that a simple momentum strategy outperformed buy-and-hold approximately 70% of the time.
In other words, buying the sector/industry groups with the largest gains outperformed buy-and-hold over a test period that exceeded 80 years. This strategy worked for 1-month, 3-month, 6-month, 9-month and 12-month performance intervals.
Furthermore, Faber also found that performance could be improved by adding a simple trend-following requirement before considering positions.
The strategy shown now is based on the findings in Faber's white paper. First, the strategy is based on monthly data and the portfolio is rebalanced once per month. Chartists can use the last day of the month, the first day of the month or a set date every month.
The strategy is long when the S&P 500 is above its 10-month simple moving average and out of the market when the S&P 500 is below its 10-month SMA. This basic timing technique ensures that investors are out of the market during extended downtrends and in the market during extended uptrends.
In his backtest, Faber used the 10 sector/industry groups from the French-Fama CRSP Data Library. These include Consumer Non-Durables, Consumer Durables, Manufacturing, Energy, Technology, Telecommunications, Shops, Health, Utilities, and Other. The last sector/industry grouping (“Other”) includes Mines, Construction, Transportation, Hotels, Business Services, Entertainment, and Finance. Instead of searching for individual ETFs to match these groups, this strategy will simply use the nine sector SPDRs.

StockCharts.com Sector Summary
The Sector Summary at StockCharts.com can be used to implement this strategy on a monthly basis. The nine sector SPDRs are shown on one convenient page with an option to sort by percentage change. First, select the desired performance timeframe by using the dropdown menu just above the table. This example uses three-month performance. Second, click the”% Chg” heading to sort by percentage change. This will place the best performing sectors at the top.
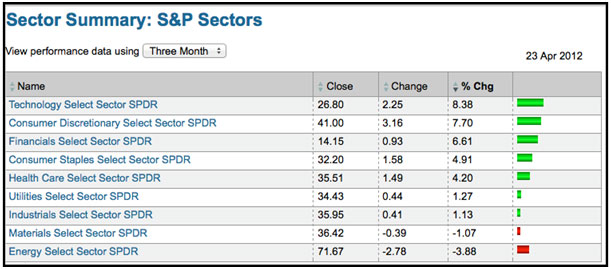
The next step is to choose the performance interval. Chartists can choose anything from one month to twelve months. One month may be a little short and cause excessive rebalancing. Twelve months may be a bit long and miss too much of the move. As a compromise, this example will use three months and define performance with the three-month Rate-of-Change, which is the percentage gain over a three-month period.
Chartists must then decide how much capital to allocate to each sector and to the strategy as a whole. Chartists could buy the top three sectors and allocate equal amounts to all three (33%). Alternatively, investors could implement a weighted strategy by investing the most in the top sector and lower amounts in the subsequent sectors.
Buy Signal: When the S&P 500 is above its 10-month simple moving average, buy the sectors with the biggest gains over a three-month timeframe.
Sell Signal: Exit all positions when the S&P 500 moves below its 10-month simple moving average on a monthly closing basis.
Rebalance: Once per month, sell sectors that fall out of the top tier (three) and buy the sectors that move into the top tier (three).
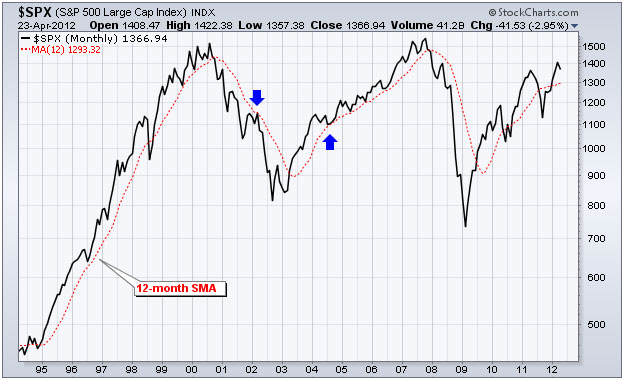
Tweaking: At the risk of curve-fitting, it seems that a 12-month simple moving average holds a strong trend better than a 10-month SMA. On the chart below, the blue arrows show where the S&P 500 broke the 10-month SMA, but held the 12-month SMA. The difference between the two moving averages is quite small and these differences are likely to even out over time. A 12-month moving average, however, does represent the one year average, which is an appealing timeframe from a long-term standpoint. Price has an upward bias when above this one-year moving average and a downward bias when below.
Such a sector rotation strategy would have avoided the 2001-2002 bear market and the gut-wrenching decline in 2008.
Conclusions
This sector rotation strategy is built on the premise that certain sectors will outperform and investing in these sectors will outperform the market overall. Even though an 80+ year backtest confirms this assumption, past performance is no guarantee of future performance. As with any strategy, self-discipline and adherence to the strategy are paramount. There will be bad months, perhaps even bad years. However, long-term evidence suggests that the good times will outweigh the bad times. This strategy can also be used as a first cut for stock selection. Traders can focus their efforts on stocks in the top three sectors and avoid stocks in the bottom six.
Designed as a starting point for trading strategy development. Using these ideas should augment your analysis process and risk-reward preferences.
CONTACT US on strategies to improve optimal portfolio construction and rebalancing.