


COMMODITIES
Soybeans
Crush Spread
A commodity trading strategy that is used in the soybeans futures market and involves the purchase of soybean futures and the sale of soybean oil and soybean meal futures. This spread is in essence a processing spread that aims to take advantage of any relative mispricing opportunities in such a futures market. Processors employ this hedging strategy to hedge the later purchase price of soybeans and the later sale price of soybean oil and soybean meal (both soybean byproducts). The term "crush" implies the process of crushing the soybeans in vats to produce oil and meal.
Reverse Crush Spread
A commodity trading strategy (an intercommunity spread) which involves the sale of soybean futures and the simultaneous purchase of soybean oil and meal futures (futures on the products). It may also involve the purchase of soybean futures and the simultaneous sale of soybean oil and meal futures.
This spread is sought by investors who expect that the gross processing margin will decline and may take advantage of the market conditions that are unfavorable to the crushers.
The reverse crush spread is an opposite strategy to the crush spread.
Trading the Spread
The laws of supply and demand act to keep this spread within a rough upper and lower limit. At the lower end, if the spread price gets too low, crushers tend to slow production thereby seeing a drop in demand for beans and less supply of the processed products. This supports and/or widens the spread.
At a higher spread price, increased crushing activity means stronger demand for beans and greater supply for meal and oil. This works to narrow the spread. Naturally speculative interest also helps keep the spread within a range.
Overall, this makes for a good market to trade using relatively simple technical analysis. Things such as oscillator divergences at extreme spread values can offer relatively low risk spread trades.
Commodities Now a Buy: Roswell Brinkman & Partners
As we said earlier, commodities had a rough June, falling some 3.64% as trade tensions between the U.S. and China escalated. This was the group’s biggest monthly slump in nearly two years, led by copper and soybeans.
Our analysts say this has created a well-timed buying opportunity, as the selloff was overdone. According to the bank, the U.S.-China trade war impact on commodities “will be very small, with the exception of soybeans where complete rerouting of supplies is not possible.
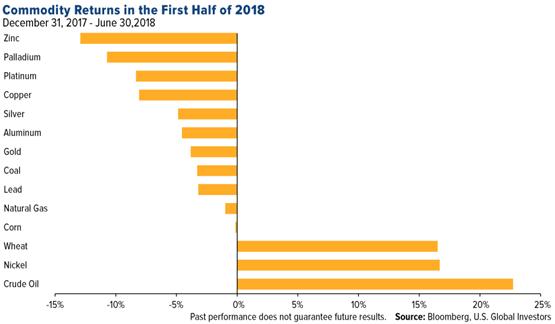
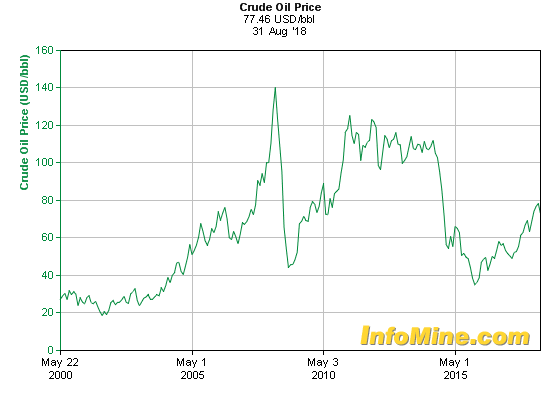
Except for a rocky June, commodities have been one of the best performing asset classes in the first half of the year. From January to the end of May, the group, as measured by the Bloomberg Commodities Index, rallied close to 3% —170 basis points ahead of the S&P 500 Index. Advances were largely driven by crude oil, which currently seeks to close above $80 a barrel for the first time since November 2014.
Of the 14 major commodities we track, oil was the standout performer, gaining roughly 23%, followed by nickel (up 16.76%) and wheat (16.51%). View our always-popular, interactive Periodic Table of Commodity Returns by clicking here.
COPPER
Even with the rise of copper in 2017, investors are still looking at a recovering market, fueled by increasing copper demand and prices.
Most market experts agree that China will heavily influence metal prices. And market demand from China is expected to be high.
Wall Street analysts are expecting the commodities sector to generate returns of almost 10% next year, which is more than other assets. Analysts are more bearish on aluminum and bullish on copper.
Roswell Brinkman Analysts belief lies in simple supply and demand. Aluminum is expected to be abundant in the coming years, whereas supplies of copper may become more constrained. This belief meshes well with the oncoming rush of electric cars, which will require copper for their batteries.
Keep an eye on copper.


METALS & MINING
If you’re serious about “blood in the streets” or contrarian investing, now is the perfect time to take a look at the mining sector.
The sector hit a low for the year earlier this month, as evidenced by the S&P Metals & Mining ETF (NYSE: XME).
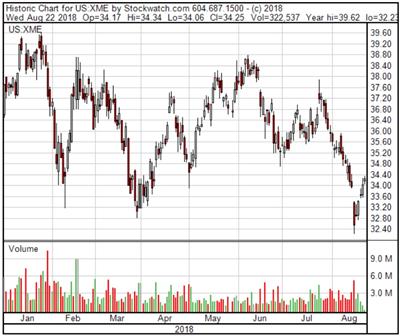
Volume has fallen off a cliff as well.
Some of that is to be expected in mid-August — the so-called “summer doldrums”
And the dollar — the world’s cleanest dirty rag of a currency — has seen relative strength, which makes everything much more expensive for everyone else.
We saw the Turkish lira collapse last week.
And metals’ prices have followed suit with the strong dollar making them ever-cheaper.
Gold has fallen from over $1,300/oz to $1,160 in less than three months. Other precious and base metals have endured the same fate.
Copper, which was in a bull market earlier this year with prices rising to near $3.20/lb, has now entered a bear market with prices falling toward $2.60/lb.
This is when you want to be buying the best-of-breed companies in the mining space.
GOLD
Now that the cheerleaders have long been shaken out, there is little to no positive emotion priced into gold. And that makes it a good time to be a buyer.
Right now, long-term investors should be particularly looking at low-cost producers that could survive in a $1,000 gold environment. There are dozens of gold miners to choose from with sub-$1,000 AISC.
Speculators going for shorter-term gains with higher risk should look to development-stage gold companies with near-term low-cost production. Again, there are dozens to choose from.
Either way, it's a good time to enter the gold market among the negative sentiment.
Buy gold stocks today.
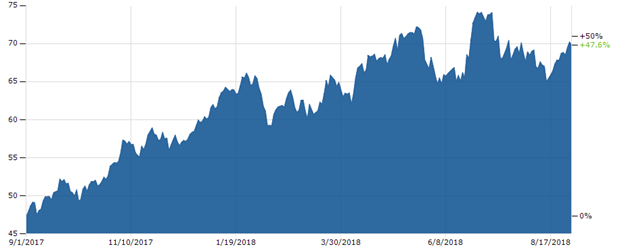
With Gold down to $1,160 per ounce. Has the yellow metal bottomed?
1-Year Gold |
5-Year Gold |
|
|
 >
>
There's no doubt that negative sentiment surrounding gold has peaked.
The most recent Commitment of Traders (COT) report shows speculative short gold positions growing for the ninth straight week. Short positions against gold are now the largest in COT history.
Media sentiment isn't any more positive. A recent article tries to explain “why gold might die out as an investment.” Meanwhile, there are a billion tweets and Facebook posts condemning the yellow metal. But despite the market's gloomy outlook, there could be a significant unforeseen increase in investment demand for gold on the horizon.
All over the world, countries are having problems with their currencies. Almost every day it seems the words “currency crisis” are in the news. Whether it's the result of financial or political factors (or both), there are many important currencies on the verge of complete collapse.
And in an environment of struggling fiat currencies, gold will shine.
Commodities are different than stocks. They are time-sensitive instruments that regenerate and self-destruct every month. Current September commodity futures contracts don’t care where the markets will be in 6 months. They only care about their price prospects on the day they expire. Because of this, they are far more sensitive to current threats than stocks and have been responding to the disastrous economic threat of a continuing trade war between the US and China (and our allies)
Corn is down. Soybeans are getting pummeled. Doctor Copper is giving us a nasty prognosis; Industrial metals like Zinc, Tin and Platinum are down anywhere from 15-35 percent.
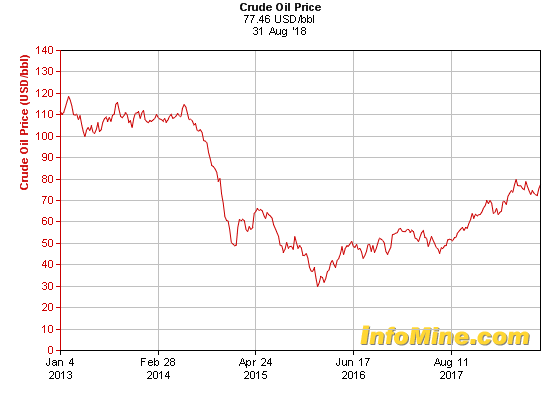
Oil
For most of the oil run-up to US tariffs starting in late May, oil has strongly bucked this general commodity collapse – proving again just how fundamentally strong it is – but even that fundamental strength is no match for the destructive economic force of a global trade war.
Oil, oil, everywhere, but not a drop to burn.
Oil, oil, everywhere, even as their drills turn.
We’ve been watching the deathward spiral of Venezuela’s oil industry for the last few years, and every time I see a chart of Venezuela oil production, I cringe.
You can see that painful picture for yourself below:

That’s the last 10 years of Venezuelan oil production, and the recent numbers are even worse. The latest reports showed that Venezuelan output fell to just 1.3 million barrels per day in June. For the record, that’s a month-over-month decline of about 48,000 barrels per day.
But let’s put a little perspective on that, shall we? That’s the lowest it’s been since the country helped found OPEC back in 1960 — 58 years ago!
More importantly, there is absolutely no realistic way Venezuela turns things around. That’s going to have serious consequences for global markets...
And one hell of an opportunity.
The most optimistic scenario for Iran is that the sanctions have no net impact. China and India increase their Iranian imports as a result of receiving heavily discounted prices. Under this scenario, global OECD stocks drop to 2.804 million barrels by year-end. This would support a WTI crude futures price of about $70/b, and so Trump may decide to release SPR barrels to get gasoline prices lower before the November elections. A release of 30 million barrels would result in a price of about $65/b. Note: these price projections are based on an inventory regression model of stocks and prices.
A more likely scenario is that sanctions have the effect of reducing Iran’s production by about 600,000 b/d.
OIL (WTI)
2018 Outlook for Natural Gas
Most of the U.S. experienced higher than normal temperatures in June, July, and August of 2016, resulting in a high use of air conditioning. This means power producers were burning more gas to meet customer demands.
Weather conditions are a short-term driving force for natural gas prices. In the winter, people use gas to heat their houses, and in the summer, natural gas generates power for their air conditioners.
Gas prices will increase because of the high demand for energy that’s needed to heat and cool homes.
A long-term driving force for gas prices is inventory dynamics.
Right now, natural gas supplies are above the five-year average and five-year minimum-maximum range, which has been putting a halt on the number of producers drilling for natural gas.
It’s important to keep a lower-than-normal inventory because when supplies are low, that means demand is outpacing production, and that will lead to higher prices. The EIA is forecasting production increases by 3.7 Bcf/d in 2017 and 77.1 Bcf/d for average consumption in 2017.
The time to buy natural gas is right now. It’s about to have one of its strongest years yet.
Demand for natural gas is soaring, and supply is exactly where it needs to be to keep prices high. And other fossil fuels like coal can’t keep up.
You don’t want to miss out on this natural gas opportunity.
Graphene
Graphene has been heralded as the gateway to a new era in science and technology, a veritable “wonder material.” As one of the simplest allotropes of carbon, it exhibits a wide range of capabilities that have amazed the public and sent scientists into a research frenzy.
At one atom thick, it is a true two-dimensional substance, and the thinnest material known to man. It also has nearly zero mass. It has an electrical conductivity six orders of magnitude higher than copper, is flexible and yet impermeable to gases. It's truly amazing.
Because it is such a diverse substance that hasn't yet found a mass-market application, it is a wide open field of investment that is essentially ONLY ground-floor opportunity.
Graphene and its close cousin, the carbon nanotube (basically a rolled-up sheet of graphene), are now some of the hottest areas of scientific research. The list of their potential disruptions is massive and the list of researchers and companies looking into the first big breakthrough is equally huge.
The Bottom Line
Graphene has garnered a tremendous amount of hype for all of its potential uses, but there has yet to be a major breakthrough in its application. By tracking various research endeavors and the growing list of graphene-related patents, niche leaders will be found. As it stands right now, it's still anybody's game.
Cobalt
Much like its cousin lithium, the cobalt metal market is in the midst of a financial mania.
Only a year ago, leading analysts projected that cobalt would hit $16 per pound by 2020. Fast-forward to today, and the price of cobalt has soared over 145% to rise from about $11 per pound to $27 per pound. Investors who were savvy enough to buy cobalt-linked investments a year ago are sitting on a tidy profit.
The question today is whether latecomers to the cobalt party can replicate early investors’ success.
So What is Cobalt Anyway?
The word “Cobalt” comes from “Kobold” — the German word for goblin. Kobolds were spirits that haunted the depths of mine shafts and often caused deadly respiratory problems for miners.
Cobalt today is a metal used for a diverse range of commercial, industrial and military applications. Most relevantly for investors, the principal use of cobalt has become electrodes in rechargeable batteries.
Cobalt is the red-headed stepchild of metals mining. A mere 6% of cobalt comes from mines focused on mining cobalt. The remaining 94% is the byproduct of nickel and copper mining. That’s why cobalt production is linked closely to the mining of these major metals. No mine in the world would increase nickel or copper production just to obtain cobalt.
Why Demand for Cobalt is Exploding
Lithium batteries are used in electronic devices, electric vehicles and energy storage. With today’s technology, 75% of lithium batteries use cobalt. Although lithium has grabbed the headlines, cobalt is actually the tougher challenge for battery suppliers. The latest technology is also shifting in favor of using cobalt. If Nickel-Cobalt-Manganese and Nickel-Cobalt-Aluminium chemistries are set to dominate for all-electric vehicles (EVs), then cobalt will become even more critical than before.
The big driver of demand for lithium batteries is, unsurprisingly, electrical vehicles. CRU Group expects global electric car and plug-in hybrid vehicle sales to top 17 million in 2030. That compares with sales of 778,000 EVs in 2016. The World Energy Council expects that every sixth car sold in 2020 will be electric.
Volkswagen (VLKAY) believes that EVs will make up 25% of vehicles sold from its own line in 2025. Norway already has announced a ban on the sale of fossil fuel-powered cars by the same year.
The Challenges of Supplying Cobalt
This explosion in demand explains why battery producers are facing a shortage of cobalt. Several cobalt producers have limited deliveries already because they simply cannot supply enough cobalt. Australia’s Macquarie Bank forecasts a deficit of 885 tons of cobalt this year. Next year, that deficit will jump to 3,205 tons and to 5,340 tons by 2019.
Cobalt has an odd production profile. On the one hand, cobalt is everywhere on earth. On the other, its low concentrations mean that there are few primary cobalt mines. And as bad luck would have it, most of the world’s supply of cobalt comes from the politically unstable West African countries. In fact, 65% of the world’s cobalt production originates from the Democratic Republic of Congo (DRC) alone — one of the most challenging places on earth to do business.
Even as demand for cobalt is exploding, the major superpowers are jockeying to control cobalt supply. The U.S. Defense Logistics Agency has started to stockpile cobalt, which it has designated “strategic and critical.”
Contact Us on our latest opinions as to opportunities in the commodities markets.